

Welcome back to the Education Policy Hotlist!
Today, we are diving into Oregon school spending. Oregon spends more than most states that are outperforming us, and a dollar entering the Oregon school system faces three ways to disappear before it reaches a student:
absorbed into legacy costs,
misdirected by a model that undercounts poverty,
or spent with no implementation or accountability system tying it to outcomes for our children.
This framework illustrates what happens to the dollars we invest in Oregon schools before they ever reach the classroom, and how our state leaders and legislators can act during the 2027 legislative session.
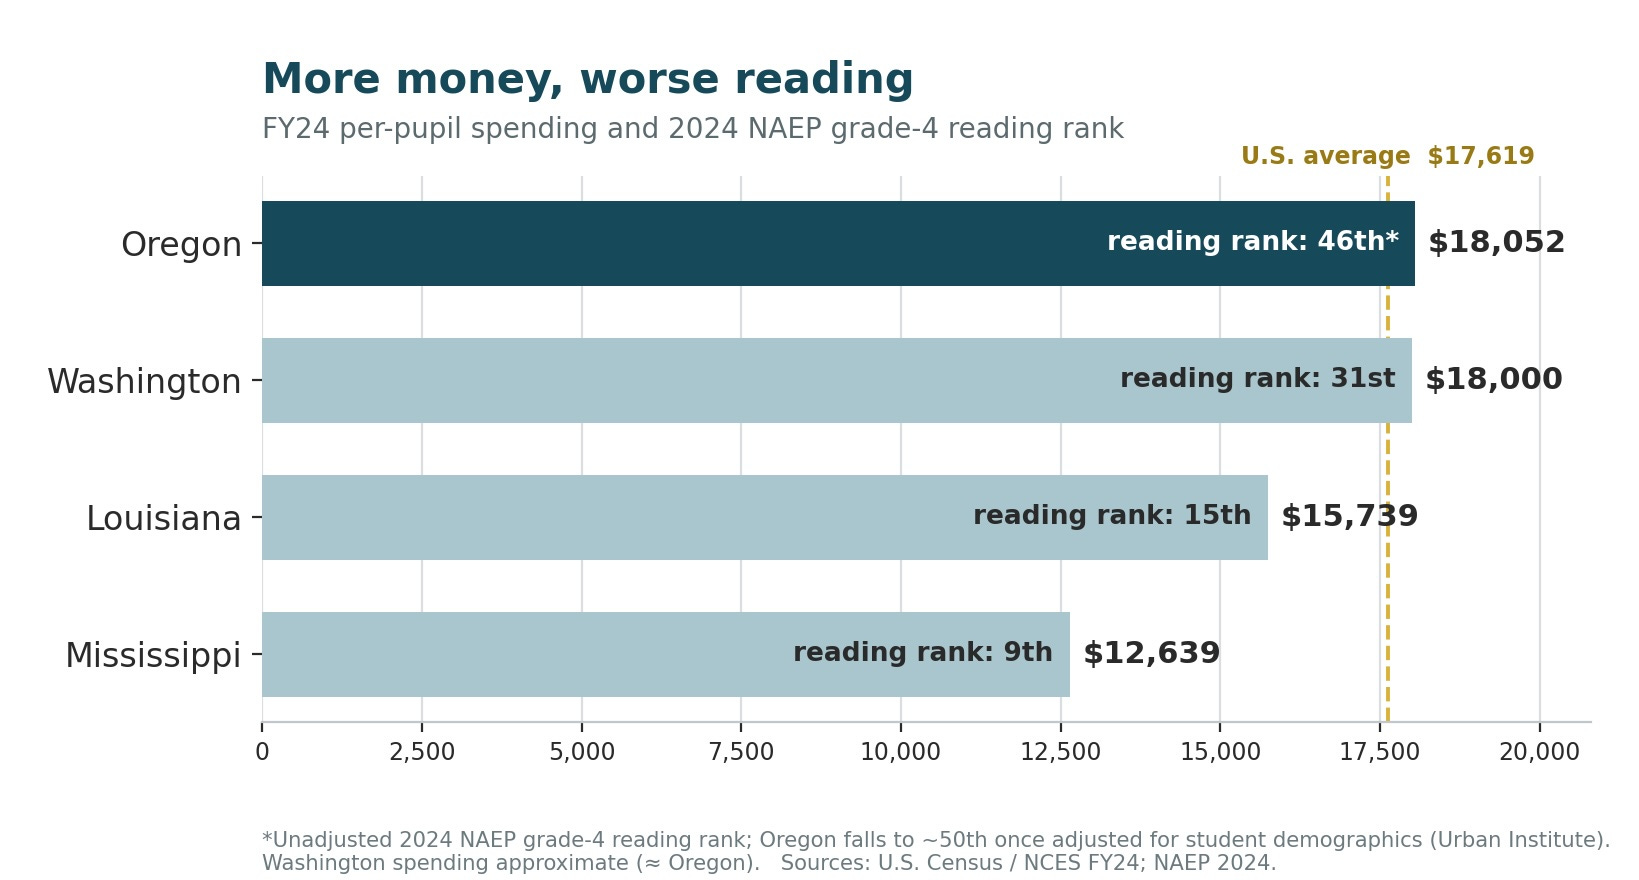
On April 15, the U.S. Department of Education released the first national picture of FY24 school spending. Oregon ranks 19th in the nation in per-pupil spending — $18,052 per student. On the federal data, Oregon is a top-20 spender.
Now set that next to outcomes. On the 2024 Nation’s Report Card, adjusted for student demographics, Oregon ranks 50th in 4th-grade reading — not 50th despite a student’s life circumstances, but 50th after accounting for systemic challenges that our children face.
Washington, which spends almost exactly what Oregon spends per pupil, ranks 31st.
Louisiana spends $15,739 per student, ranks 15th, and is up 6 points since 2019.
Mississippi spends $12,639 and is now among the strongest reading states in the country.
For a neutral benchmark, the national average is $17,619 per pupil (FY24). Oregon spends above it; Louisiana and Mississippi spend well below it — and still outperform us on reading measures.
Comparisons to Louisiana and Mississippi invite a fair objection: those states have lower costs of living and weaker public-sector unions, which hold their spending down. That is exactly why the national average is the most telling yardstick — measured against it, Oregon still spends more than most states and reads worse than nearly all of them.
So the question Oregon has not really answered is this: how does a state in the top tier of spending land in the bottom tier of results?
I don’t think additional money does much good until that question is answered. From federal data, I can identify three places where Oregon’s dollars go wrong — they are absorbed, misdirected, or fail to reach a system to make them work.
Each has a concrete fix for 2027, and two of them require no new money at all — I lay all three out at the end.
1. Much of the money is spent before it reaches a classroom
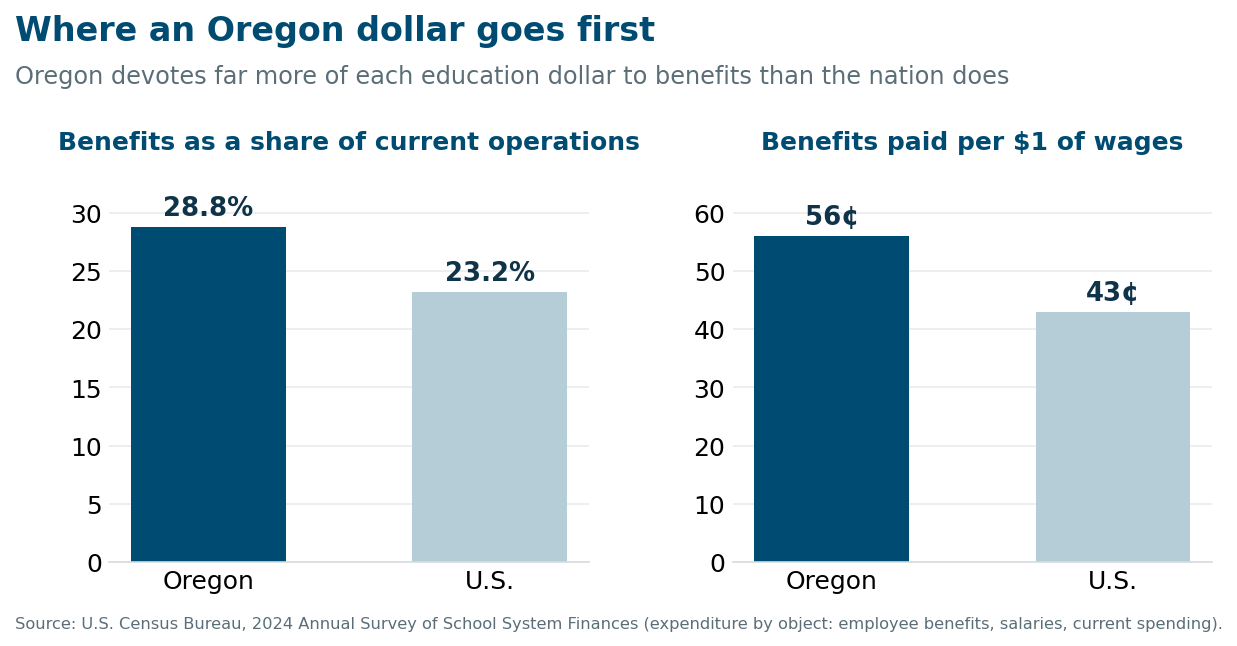
Oregon spends $5,205 per pupil on employee benefits — 27 percent above the national average. Benefits now consume 28.8 percent of every dollar the state spends on current operations, against 23.2 percent nationally. For every $1 Oregon pays in wages, it pays 56 cents in benefits; the national figure is 43 cents.
According to one national analysis, Oregon ranks fourth in the country for the generosity of its teacher retirement benefits — another reason the “not enough money” framing strains against the data.
The main driver is PERS, the public employee pension system. Average school-district employer contribution rates now exceed 20 percent of payroll and continue to climb. New dollars enter the system and are consumed by legacy costs before they reach a classroom or intervention.
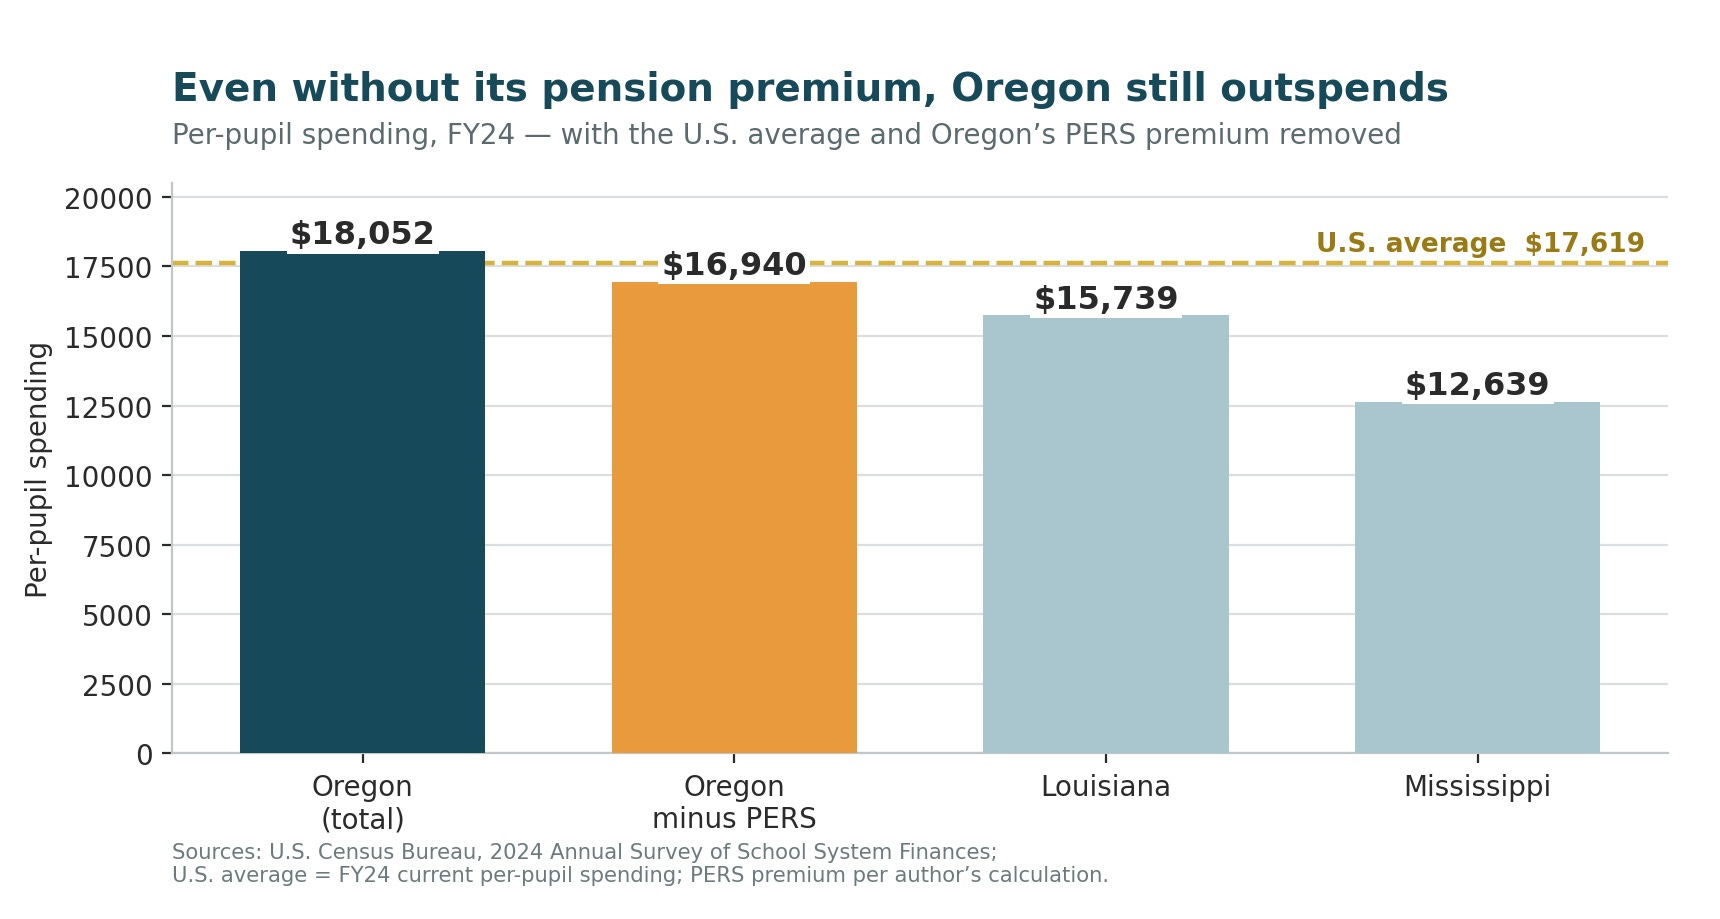
This is also where the Oregon conversation tends to go off the rails, so it is worth being precise. PERS is a real cost pressure, but it is not the explanation for our results. Strip out Oregon’s entire PERS benefits premium and the state would still spend roughly $16,940 per pupil. That is more than Louisiana, Tennessee, and Mississippi.
Two things are true at once: Oregon schools carry a genuine PERS burden, which varies by locale (a topic for another time), and they post worse outcomes than states that spend far less on instruction. The first does not account for the second.
The implication is narrower than “fix PERS.” If the legislature adds money in 2027, it should fence it — categorically protect new dollars for instruction (curriculum, coaching, extended learning, and literacy and numeracy) so they are not absorbed at the same 28.8 percent rate as everything else.
2. Oregon is the only state that counts its students in poverty with a model instead of a list
This is the part I find hardest to defend, because correcting it costs nothing.
Oregon is the only state that uses the Census Bureau’s Small Area Income and Poverty Estimates (SAIPE) as the primary poverty driver in its school funding formula. Every other state uses direct certification, which matches enrollment against rosters for SNAP, TANF, Medicaid, foster care, homelessness, and migrant students. One approach is a list of actual children; the other is a statistical model.
The current model has three problems. It undercounts children in poverty. It lags reality by about 3 years, so a district’s 2026–27 funding reflects economic conditions from earlier years. And it lurches: SAIPE revisions arrive in February and can pull funding out of a district mid-year.
What moves this from unfortunate to indefensible is that Oregon already uses direct certification for academic outcome reporting. The data exist, and the state trusts them; it simply declines to use them in the one place that moves money to kids.
The Oregonian’s Julia Silverman has reported the same conclusion about the formula’s poverty undercount (Oregon “most regressive” in funding high-poverty districts). It is a 2027 fix that requires no new revenue, only the decision to count accurately.
3. Even when the money lands in the right district, nothing connects it to results
Set PERS and the formula aside, and Oregon still outspends most of the states that beat it. Louisiana ($15,739) is one of only two states reading above its pre-pandemic level. Mississippi ($12,639) is in Massachusetts’s range for reading. The variable separating them from Oregon is not dollars; it is that they operate a coherent education system focused on the instructional core — a defined destination and a means of measuring progress toward it.
Oregon does not, and the state is unusually candid about it. Its performance growth targets do not require any school or district to reach a statewide bar. When the Department of Education presented its new twelve-year statewide targets to the State Board in April 2026, it stated that these “are not the targets for individual districts or charter schools, and districts and charter schools will not be directly held accountable to these numbers.”
Districts instead negotiate their own four-year targets for incremental growth off their historical baselines. SB 141, the 2025 law meant to fix accountability, encodes the same move: destinations set as forecasts rather than the high standards that our children deserve and our economic growth requires.
The way those targets are built has an equity problem worth stating plainly: the design bakes a structurally lower bar in place for students of color and students living in poverty.
Districts are sorted into clusters of demographically “similar” peers — grouped by poverty, English-learner enrollment, and mobility — and then assigned percentile targets relative to that cluster and their own starting point. Because those grouping factors track closely with race and income, the practical effect is a lower expectation for the districts serving the most Black, Latino, and Native students and the most students in poverty, and a higher one for the districts that already begin ahead.
This cluster-target approach reifies a statewide tracking system: districts serving the most diverse, highest-poverty student populations are systematically assigned lower achievement targets than districts that start ahead. Both the forecasting and clustering models encode the same assumption — that some students will achieve less — and those students are, systematically, the children who have faced structural and intergenerational barriers to economic mobility in this state. A system that formalizes lower expectations along lines that closely track race and income should trouble us, whatever its intent.
What the data imply for 2027
I draw three implications from the federal numbers, and none of them is “spend more and hope.”
First, protect new instructional dollars. Any 2027 State School Fund increase should include categorical protection for evidence-based instruction, curriculum, coaching, extended learning, early literacy, and numeracy. This takes no position on PERS reform; it simply keeps money appropriated for students from being absorbed before it reaches them.
Second, count poverty using direct certification — the measure Oregon already uses for outcome reporting — and add a concentration weight, modeled on Massachusetts (concentration-based) or California (threshold-based), so that the highest-need students and local education agencies are funded accordingly. The cost in new revenue is zero.
Third, give SB 141 absolute standards tied to local measures. Move the framework from historically calibrated growth to absolute statewide standards with adaptive implementation pathways, on the model of Louisiana’s Grow. Achieve. Thrive. system — designed by the state team now advising other states through Watershed Advisors: the same bar for every school, with local flexibility in how to reach it, rather than whether it is reached.
The part I keep returning to
For a long time, the Oregon education debate has had a single setting: the state is underfunded, and more money will fix it. The FY24 data do not support that story — and the three leaks I opened with are the reason why. Each is a place where a dollar meant for a child goes somewhere else first.
That is not an argument against funding schools. It is an argument that the job in front of us is to make our leaders connect “more money” to “better outcomes” — and to stop treating the two as the same sentence until the structure between them actually works.
And here is the part I find genuinely hopeful. Every one of these failures is structural, which means each is within Oregon’s control. We are not waiting on the economy or on Congress. We can change how we count students in poverty, how we protect instructional dollars, and how we set and enforce goals. The funding formula, the accountability system, and the governance that runs both — these are our own decisions, made by our own institutions, and they are in the hands of our leaders.
Oregon is not underfunded. It is misstructured. And structure is the one thing state leaders can simply choose to fix.
About Dr. Christine Toribio Pitts
Christine is a mom of four, an education policy leader, an advocate, and the President and CEO of Open School Inc., where she works to advance evidence-based strategies that improve outcomes for students and families in Oregon. With a background in teaching, research, and advocacy, she is committed to ensuring education policy and practice are driven by research, not rhetoric.
If a significant share of education dollars never reaches instruction, what exactly are Oregon taxpayers funding? Benefits and legacy costs are not a student outcome strategy.
I really appreciate people digging into and getting passionate about solving our schools performance and financial challenges. I shared this with a bunch of parents and our PTA pres.